Problem
For this lab, we were asked to measure the velocity of a electric toy buggy using three methods; stopwatch, motion, and video analysis.
Stopwatch
RESEARCH QUESTION: How does time allowed relate to difference in position?
For this portion of the lab, we used a stopwatch and a marked track to measure the difference in position over certain amounts of time. We began our testing at 0.5 seconds of movement, and we took 10 points of data with a maximum time of 5 seconds. For each individual point, we started the buggy and the stopwatch at the same time, and stopped the car when the stopwatch manager observed the allotted time. We then recorded the distance in centimeters.
Independent Variable: Time (s)
Dependent Variable: Position (cm)
Constants: surface, the toy buggy, the environment

Time (Corresponding Position)
0.5 s (25 +/- 1 cm)
1.0 s (35 +/- 1cm)
1.5 s (49 +/- 1 cm)
2.0 s (56 +/- 1 cm)
2.5 s (67 +/- 1 cm)
3.0 s (75 +/- 1 cm)
3.5s (87 +/- 1 cm)
4.0 s (92 +/- 1 cm)
4.5 s (105 +/- 1 cm)
5.0 s (114 +/- 1 cm)1
0.5 s (25 +/- 1 cm)
1.0 s (35 +/- 1cm)
1.5 s (49 +/- 1 cm)
2.0 s (56 +/- 1 cm)
2.5 s (67 +/- 1 cm)
3.0 s (75 +/- 1 cm)
3.5s (87 +/- 1 cm)
4.0 s (92 +/- 1 cm)
4.5 s (105 +/- 1 cm)
5.0 s (114 +/- 1 cm)1
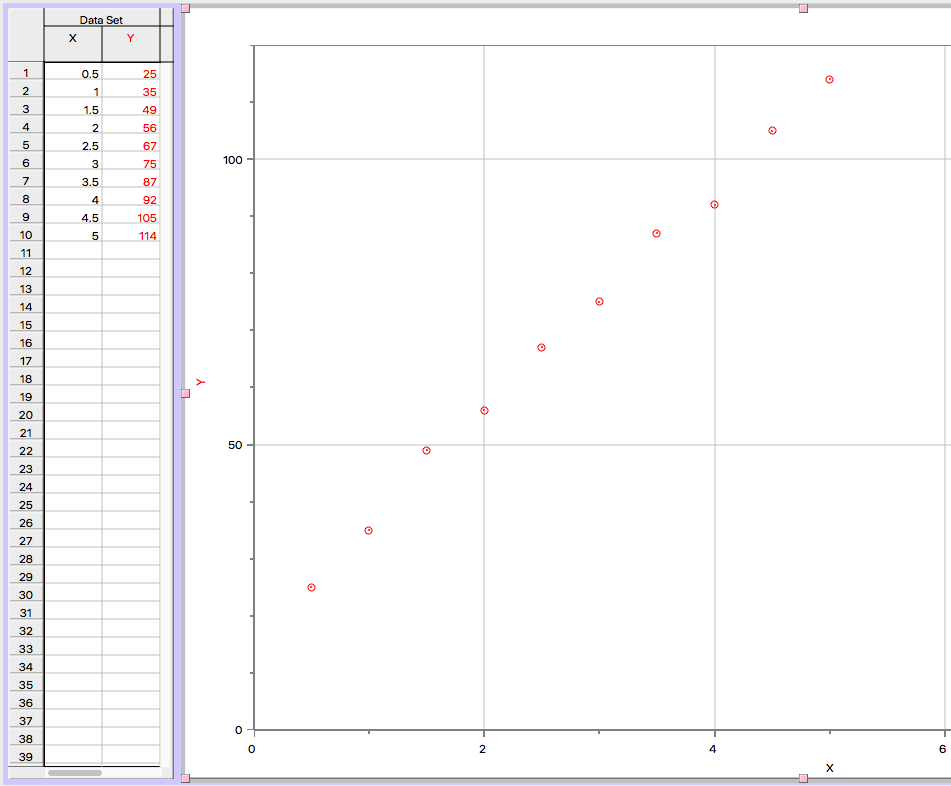
Slope: 19.48 Y-Int: 16.93 Correlation: 0.9983 RMSE: 1.834
This graph shows a clear linear progression of the points, which is the same as a nearly constant velocity. There is no clear form of acceleration.
Motion
RESEARCH QUESTION: How does difference in position relate to time?
In this section of the lab, we set up a motion sensor at on end of the track white look down the length of the ramp. This sensor was able to capture exact data points for the difference in position over a certain amount of time. Timing began at 0.05 seconds and points were taken in intervals of 0.05 up until 10 seconds, for a total of 200 points taken.
Independent Variable: Position
Dependent Variable: Time
Constants: surface, the toy buggy, the environment, the motion sensor

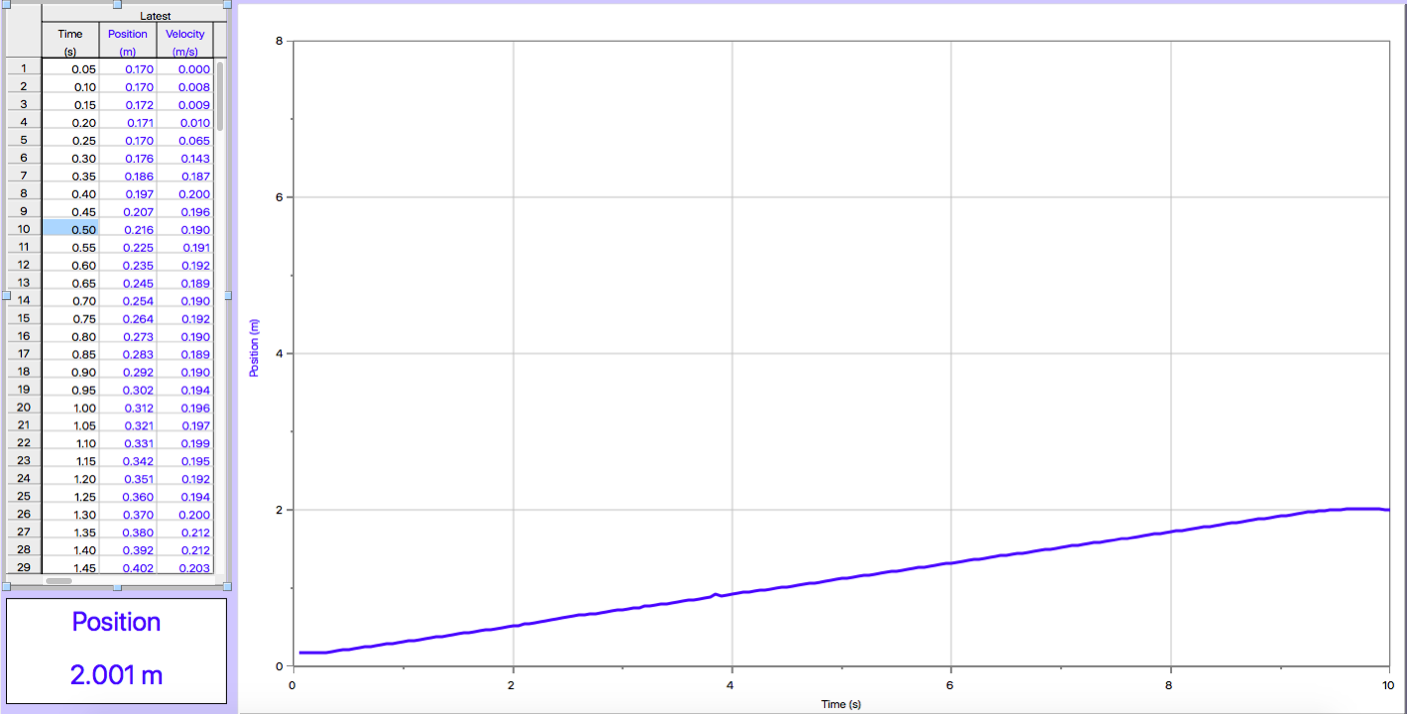
This graph shows a linear progression, where the motion of the buggy begins and ends with a cushion of delay. The lack of curvature to the line shows no acceleration in the difference in position.
Video Analysis
RESEARCH QUESTION: How does difference in difference in position relate to time?
For this portion of the lab, we recorded a video of the buggy making its way across the track. Then, in the video analysis section, I followed the analysis process to create a graph in the LoggerPro application.
Notice: I entered the points in reverse order because the video we took went from right to left instead of left to right. This caused the line to have a negative slop, so interpret the graph in reverse order.
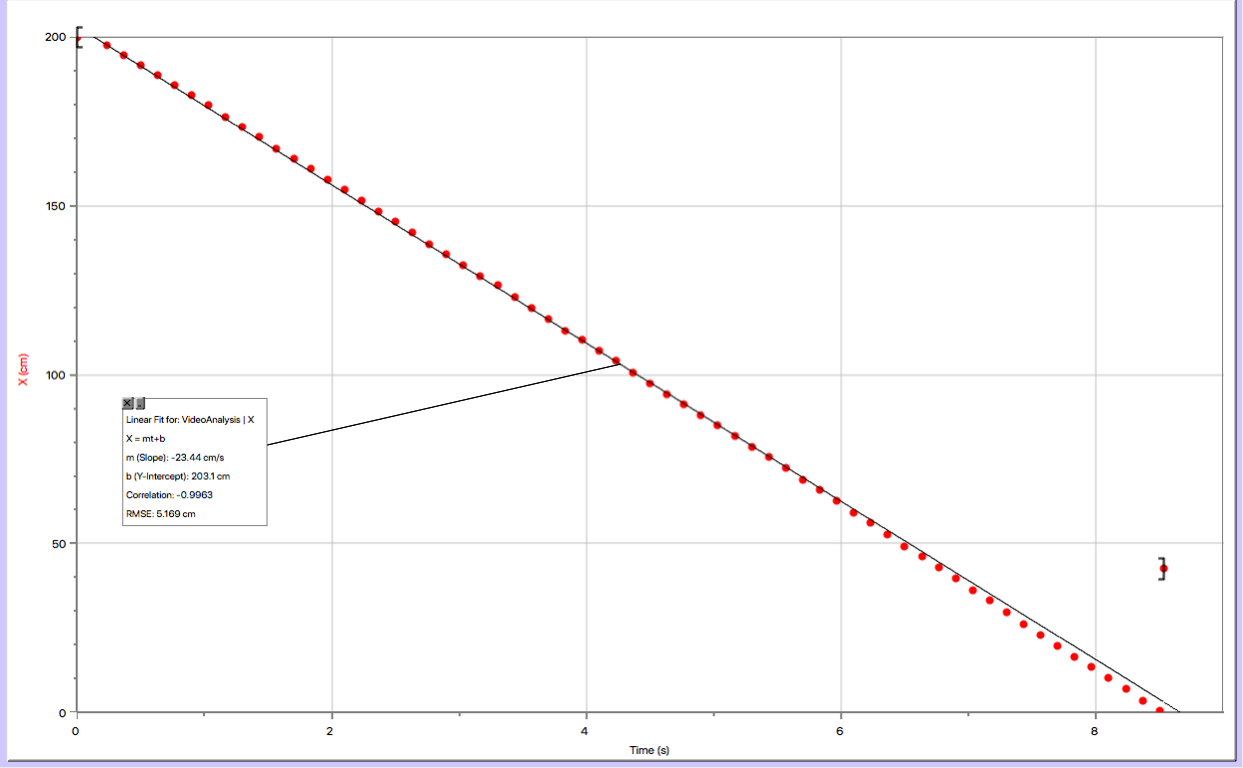
Slope: 23.44 Y-Int: 0 Correlation: -0.9963 RMSE: 5.169
When the line is reversed for a more accurate graph of the points, the line shows a linear progression. This directly relates time and difference in position equally.
Conclusion
Body
Over all three tests, we made an attempt to determine the relationship between difference in position and time. A constant them over the trials was a linear progression of the distance in relationship to time. In addition, the slopes of the graphs and the correlation were similar proving that the speed of the car was nearly consistent throughout the trials. We concluded in the tests that the performance of the buggies over the three trials were similar, and the best form of testing in my opinion was the motion sensor. This is because the device was operating on a computer and that leaves nearly no room for error in the recording of data.
Evaluating Procedures
The main weakness for the stopwatch trial was that the recording of exact time and position rely on human reaction speed which can be inconstant. These two forms of data are the uncertainties in this trial, as the measurements may not be exact and are estimations. The main weakness for the motion trial was the method used to record the data. The letting go and the stopping of the buggy provided the motion sensor with inaccurate points which could affect the velocity and the graphed points. The uncertainty in this trial lied in the condition of the motion sensor, as it is unknown to us that if we were to use a brand new sensor that the data may be different. The main weaknesses for the video analysis trial were the procedure to which the video is analyzed, and the recording of our video. We set up the video going the wrong direction so that the points are reversed, and the LoggerPro analysis was complicated and difficult to execute. Uncertainties lie in my ability to analyze the video perfectly and calculations/accommodations made to compensate for the reversed order.
Improving the Investigation
I would recommend to future physicist to record the distance of the buggy and the stopwatch in slow motion so that the data points can be more accurately recorded.
