Procedure
In this experiment, we tested the characteristics of impulse and challenged the idea that impulse is the following; the area under a force vs. time graph, the average force over a period time, and the change in momentum
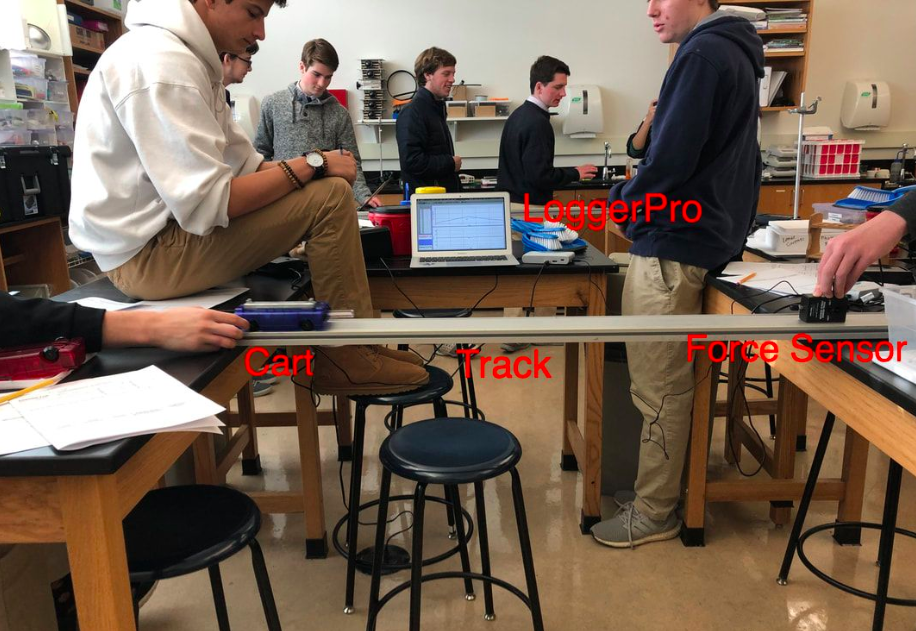
We set up a cart and track system to test the impact a weighted cart would have on a force sensor. In doing this we...
1. Made sure track is balanced and not uneven
2. Put the motion sensor at the beginning of the track, as shown in the picture .
3. Placed the force sensor at the other of the track so that the actual sensor is facing the cart. Also, make sure the force sensor is held tightly so that it does not record inaccurate results.
4. Released the plunger of the cart so that it is sticking out and ready to hit the force sensor. Rolled the cart away from the motion sensor and recorded it simultaneously with LoggerPro.
5. Recorded the data from the force sensor and used it with the data collected through LoggerPro.
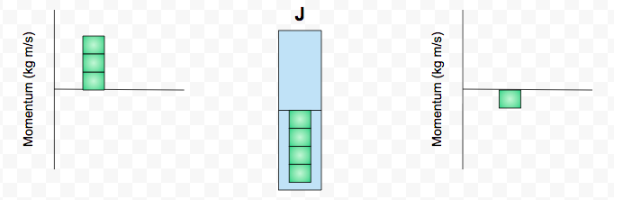
Bar Chart
Logger Pro Graphs
Desmos Graph
|
|
Velocity vs Time is in Red Momentum vs Time is in Blue |
Initial momentum must be positive because it is moving away from the motion sensor. The force sensor gives a negative impulse because it sends the cart in a backwards direction. It has less momentum after because it slowed down from the impact.
Calculations
P-Initial= 0.501kg * 0.47m/s = 0.23 kgm/s
P-final= 0.501kg * -0.355m/s = -0.17 kgm/s
J= P final - P initial = -0.42 kgm/s
Impulse from Force vs Time Graph= -0.37 kgm/s
Percent Difference: |-.41+0.37| / 0.37 = 1.01%
P-Initial= 0.501kg * 0.47m/s = 0.23 kgm/s
P-final= 0.501kg * -0.355m/s = -0.17 kgm/s
J= P final - P initial = -0.42 kgm/s
Impulse from Force vs Time Graph= -0.37 kgm/s
Percent Difference: |-.41+0.37| / 0.37 = 1.01%
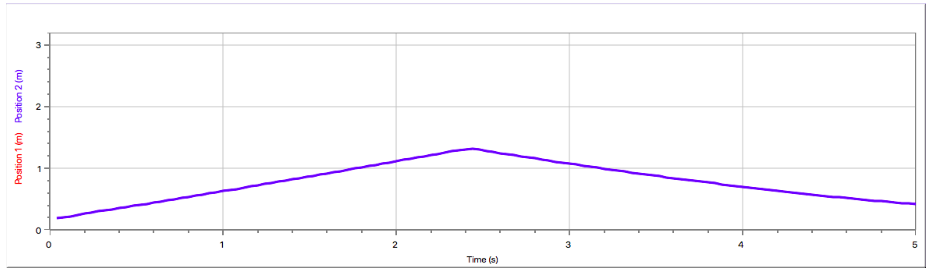
The position vs time graph gave the initial velocity of 0.477m/s by finding the slope before the cart changed directions.
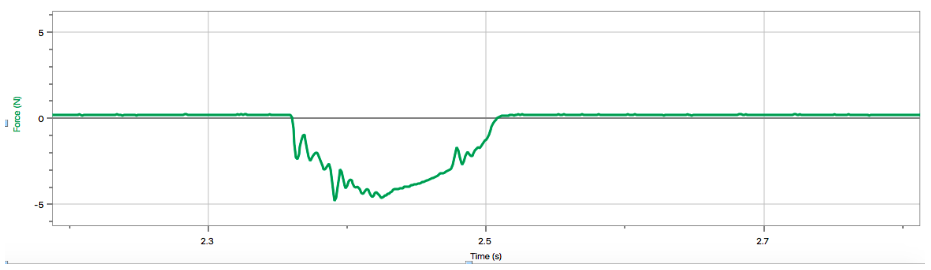
We were able to find the final velocity by using of the slope of the position vs time graph when it was moving in a negative direction, which was -0.355m/s. The mass of the cart was 0.501kg which helped us find the initial and final momentum. We plugged the values into the formula P=mv. This left us with an impulse value -0.416832 kg m/s. To find if the area under a Force vs Time Graph was equal to the impulse, we used the force graph that LoggerPro had recorded from the experiment. The area under it was equal to -0.3783 kg m/s. This left a 1.01% value difference, which means one can conclude that impulse is equal to change in momentum and the area under a force vs time graph.
We were able to find the final velocity by using of the slope of the position vs time graph when it was moving in a negative direction, which was -0.355m/s. The mass of the cart was 0.501kg which helped us find the initial and final momentum. We plugged the values into the formula P=mv. This left us with an impulse value -0.416832 kg m/s. To find if the area under a Force vs Time Graph was equal to the impulse, we used the force graph that LoggerPro had recorded from the experiment. The area under it was equal to -0.3783 kg m/s. This left a 1.01% value difference, which means one can conclude that impulse is equal to change in momentum and the area under a force vs time graph.
Widget is loading comments...
